
数字化家谱
尝试数字化家谱。
自己由于做IT方面的工作,一直想把家谱数字化来着,这个周末花了两天,弄了个雏形,放在网上了,大家多提意见把。没有耐心的可以直接上了: http://yuanqingfei.me/familyTree/
基本想法
家谱从算法的观点看其实就是一颗典型的树,所以打算从两方面入手,一个是树形图显示,这个主要方便查看,没啥好说的。另外一个就是家谱的数字化查询,基本的几个场景有:
- 任意两个人的最近一个共同祖先;
- 找出一个人到始祖的最短路线;
- 任意两个人是否在“五服”之内;
还可以做些有趣的查询:
- 家谱中那个人的儿子最多;
- 家谱中那个人的孙子最多;
- 家谱中那个除了始祖之外,那个人的后代最多;
- 给定任一代,找出后代最多的那个人;
- 家谱中没有生出男孩的有那些(也就是家谱中表示为“至”的);
- 家谱中没有长大就死亡的(也就是家谱中表示为“夭”的);
- 家谱中过继儿子的有多少;
- 家谱中人口增长曲线
如果在对每一个点创建一个基本的数据单元,还可以做相关的查询,比如:
- 家谱中那个人的老婆最多;
- 家谱中那个人的官最大,学位最高;
- 家谱中那个人最开始迁移;
- 家谱中那个人迁移的最远;
基本步骤
上面想法虽然很多,现在只能做第一步,就是做个简单的树形图展示,其他慢慢来把。这两天算是个开始。
- 由于现在react已经非常成熟,故采用react 16.0版本.
- 数据目前使用Json格式
- 由于家谱图往往很多人,所以要可以缩放,而且还不能影响图像质量,所以采用了svg path,具体的参考框架就是两个: path-js 和 svg-pan-zoom.
- 创建项目使用 create-react-app
- 发布项目使用 gitpages,具体步骤请参考这里。
步骤不是很复杂,下面做个简单的展示:
好了,话不多说,有兴趣可以自己去尝试下,http://yuanqingfei.me/familyTree/
现在还比较粗糙,肯定有不完善支出,有意见可以在这个文章下面留言。谢谢。
下一步
要基于d3-hierarchy做些尝试,把基本的树算法都用上。写个小工具来生成数据json文件。因为这个数据录入的力气活真不是人干的,我这次眼都花了。。。- 基于scala-js来完成前后台统一开发。
20180220更新
- 使用d3-hierarchy中的工具stratify来解析dsv,从而自动生成树。也就是把如下的csv数据自动构造成能满足树形图需要的json.
id|name|parent|description
00001|清||全,仲七
00002|仲|00001|
00003|玘|00002|
00004|洪|00003|配辛,吴氏
00005|河|00003|
    dsv("|", yuanCsv, function (d) {
      return {
        id: d.id,
        name: d.name,
        parent: d.parent,
        description: d.description
      };
    }).then(function (data) {
      var myRoot = stratify()
        .id(function (d) { return d.id; })
        .parentId(function (d) { return d.parent; })(data);

    });
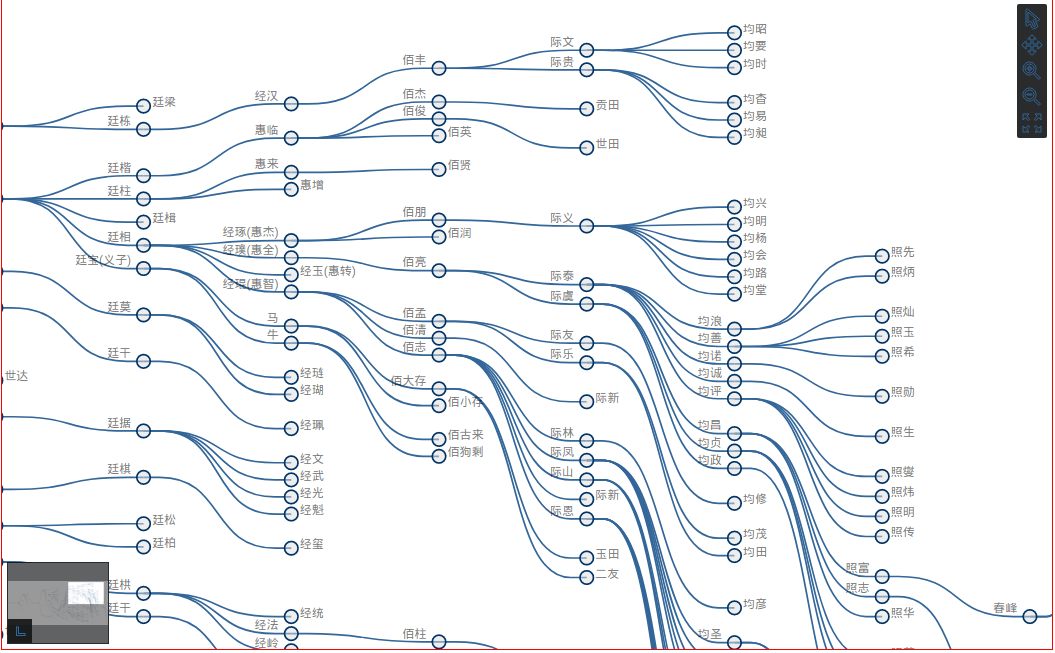
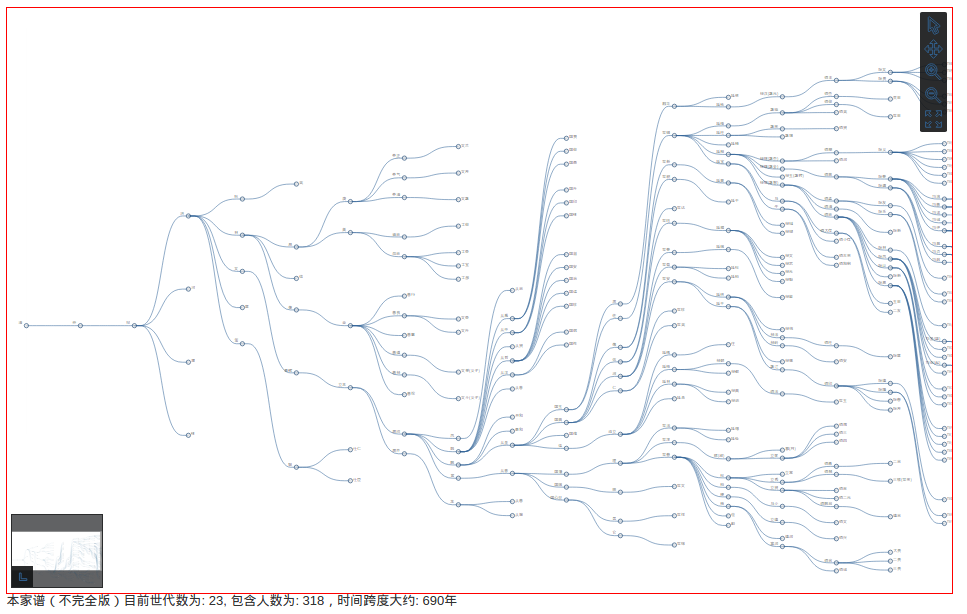
- 用d3-hierarchy来生成树(tidy tree),通过对比可以看出他们的区别. pathJs算法更有效利用空间,但是d3Hierarchy是更清楚些。相同点是每一代都在同一竖线上,很好分辨,下一步打算在此基础上加上班辈和世代。
20180303更新
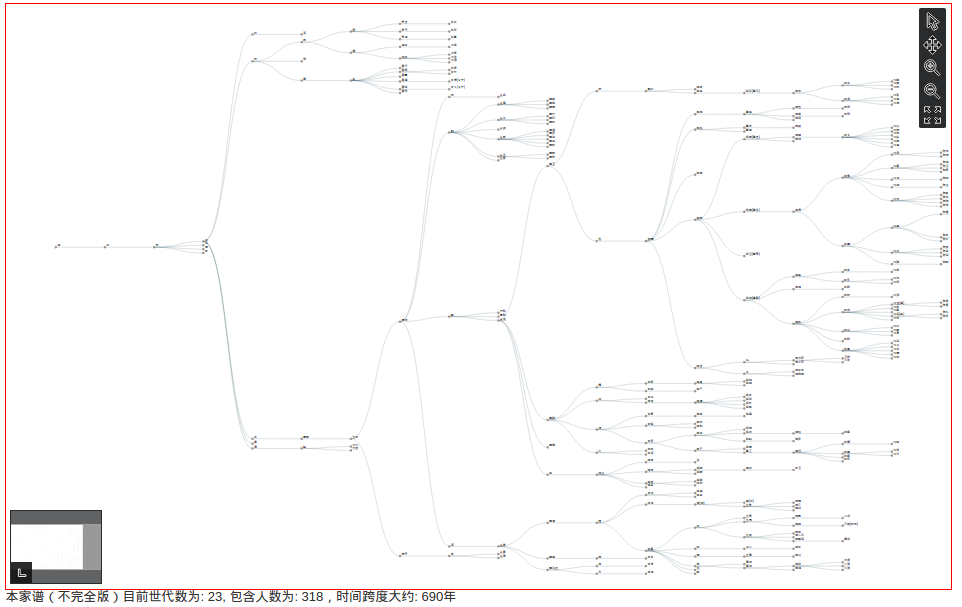
- 使用d3-graphviz来渲染这棵家族树,算法果然又不一样,可以参考下面的结果。

- 在把女性计入家谱的情况下,由于会出现表亲结婚的情况下,所以就会变成DAG(有向无环图),可参考下面描述:
Family trees may be seen as directed acyclic graphs, with a vertex for each family member and an edge for each parent-child relationship.[44] Despite the name, these graphs are not necessarily trees because of the possibility of marriages between relatives (so a child has a common ancestor on both the mother’s and father’s side) causing pedigree collapse.[45] The graphs of matrilineal descent (“mother” relationships between women) and patrilineal descent (“father” relationships between men) are trees within this graph. Because no one can become their own ancestor, family trees are acyclic.
20180330更新
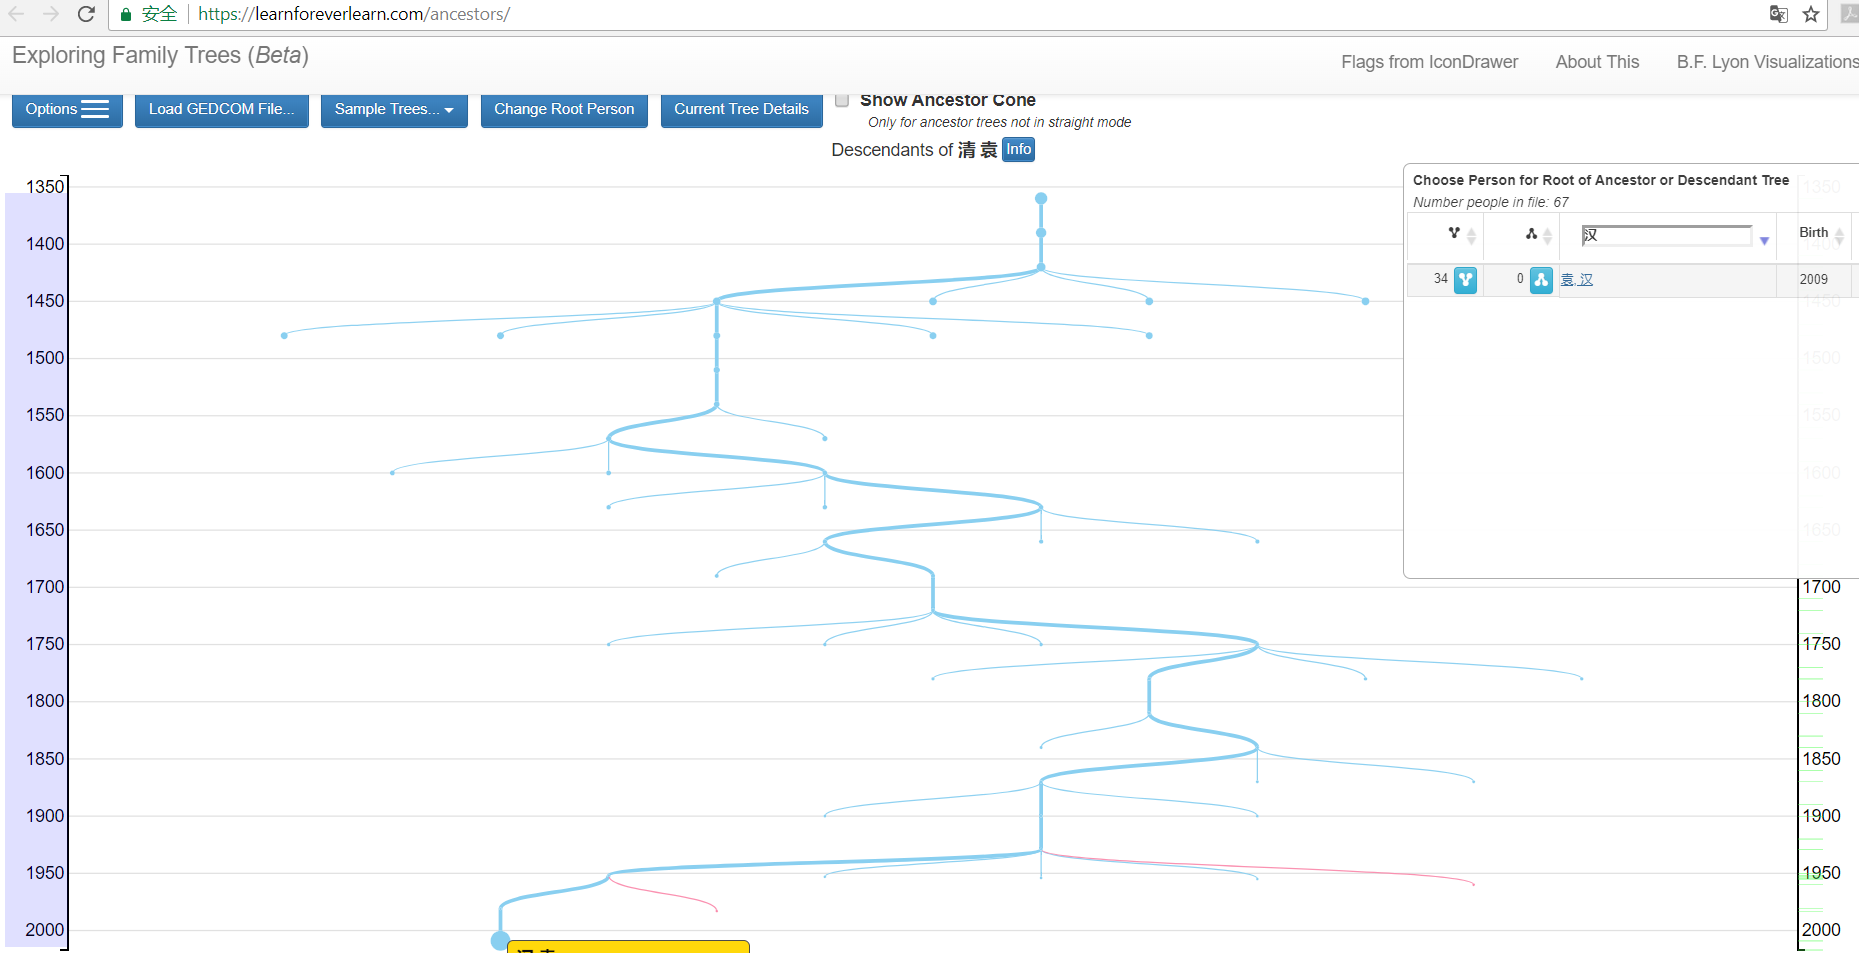
- 网上有人用d3做了一个工具,很好用: https://learnforeverlearn.com/ancestors/, 我通过使用Grapms创建家族树,然后导出为ged文件,很方便的就可以导入到上述网站,可以看到时间轴。
- 下一步还是打算先用Scala实现一个后台ged解析器,然后再考虑前台的事情。
20180408更新
-
之前做的dot版本是基于d3-graphviz,可是由于它对于react的支持不够好,一直没能放到一起去。最近给d3-graphviz提了个改进,原作者修改好了。这样就可以把dot版也整合在一起去了。故删掉 http://yuanqingfei.me/familyTree-dot/
-
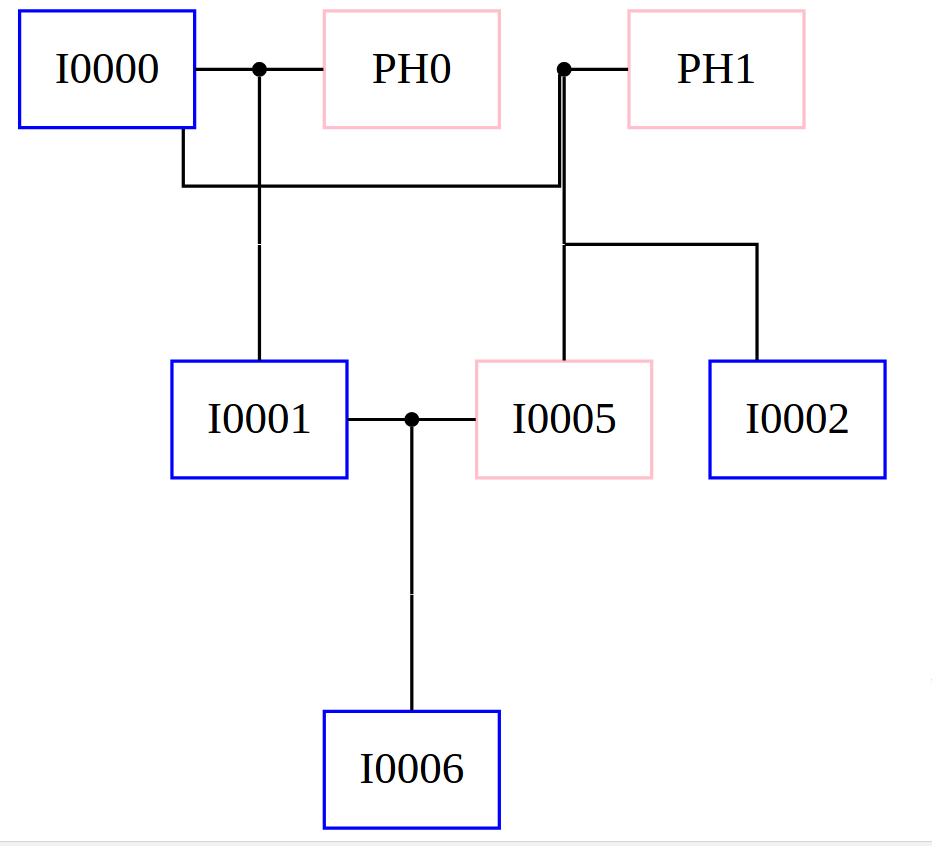
设想一个比较极端的例子,一夫二妻,同夫异母兄妹结婚。这样的DAG用dot应该如何描述。 根据ged2dot的启发,大概是这样
digraph {
    splines = ortho;
    node [shape = box, color=blue];
    edge [dir = none];

    subgraph Depth0 {
        rank = same

        PH0 [ color = pink ]
        PH1 [ color = pink ]

        I0000AndPH0 [ shape = point ]
        I0000 -> I0000AndPH0 -> PH0

        I0000AndPH1 [ shape = point ]
        I0000 -> I0000AndPH1 -> PH1
    }

    subgraph Depth0Connects {
        rank = same

        I0002Connect [ shape = point, width = 0 ]
        I0001Connect [ shape = point, width = 0 ]
    }

    I0000AndPH0 -> I0001Connect -> I0001
    I0000AndPH1 -> I0002Connect

    I0002Connect -> I0002
    I0002Connect -> I0005

    subgraph Depth_1 {
        rank = same

        I0001
        I0002
        I0005 [ color = pink ]

        I0001AndI0005 [shape=point]
        I0001 -> I0001AndI0005-> I0005
    }

    subgraph Depth_1Connects {
        rank = same

        I0001AndI0005Connect [shape=point, width=0]
    }

    I0001AndI0005 -> I0001AndI0005Connect -> I0006

    subgraph Depth_2 {
        rank = same
        I0006
    }
}
在http://viz-js.com/ 渲染的结果确实不怎么美观,但是能满足基本需要。
- 根据stackoverfow的方案
digraph G {
edge [dir=none];
node [shape=box];

"Herb"      [shape=box, regular=0, color="blue", style="filled" fillcolor="lightblue"] ;
"Homer"     [shape=box, regular=0, color="blue", style="bold, filled" fillcolor="lightblue"] ;
"Marge"     [shape=oval, regular=0, color="red", style="filled" fillcolor="pink"] ;
"Jackeline" [shape=oval, regular=0, color="red", style="filled" fillcolor="pink"] ;
"Abraham"   [shape=box, regular=0, color="blue", style="filled" fillcolor="lightblue"] ;
"Mona"      [shape=oval, regular=0, color="red", style="filled" fillcolor="pink"] ;
"Bart"      [shape=box, regular=0, color="blue", style="filled" fillcolor="lightblue"] ;
"Maggie"    [shape=oval, regular=0, color="red", style="filled" fillcolor="pink"] ;

a1 [shape=diamond,label="",height=0.25,width=0.25];
a2 [shape=diamond,label="",height=0.25,width=0.25];
{rank=same; Abraham -> a1 -> Mona; Abraham -> a2 -> Jackeline};

b1 [shape = point, width=0];
b2 [shape = point, width=0];
b3 [shape = point, width=0];
{rank=same; b1 -> b2 -> b3};

a1 -> b2
b1 -> Herb
b3 -> Homer
a2 -> Marge
{rank=same; Herb; Homer; Marge};

// new genration
a3 [shape=diamond,label="",height=0.25,width=0.25];
{rank=same; Herb -> a3 -> Marge}

b4 [shape = point, width=0];
b5 [shape = point, width=0];
b6 [shape = point, width=0];
{rank=same; b4 -> b5 -> b6};

a3->b5
b4-> Maggie
b6->Bart
}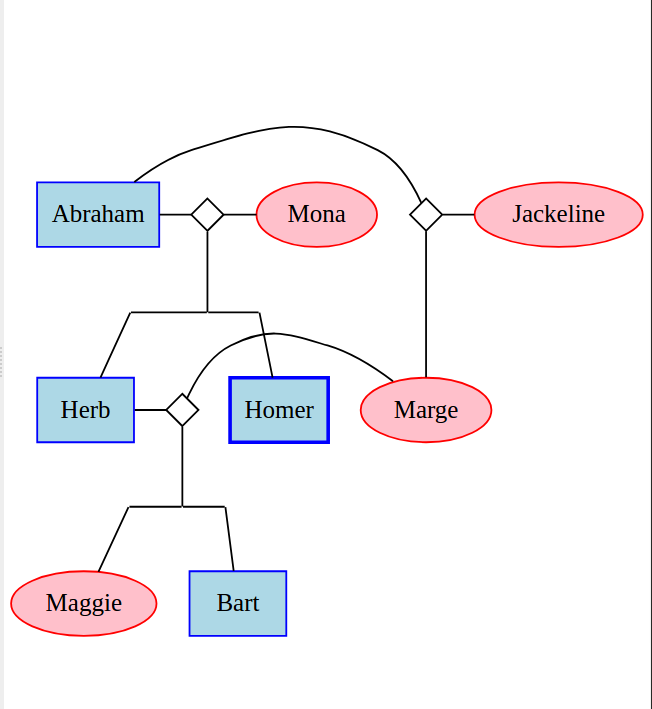
20180415更新
初步采用第一种方案,写了个大概,目前问题是 扭曲导致 1)兄弟顺序不对 2)重叠导致不美观 3)加人物照片 4)动态生成dot字符串。 http://yuanqingfei.me/familyTree-gedcom/
20180424更新
加入图片


Comments